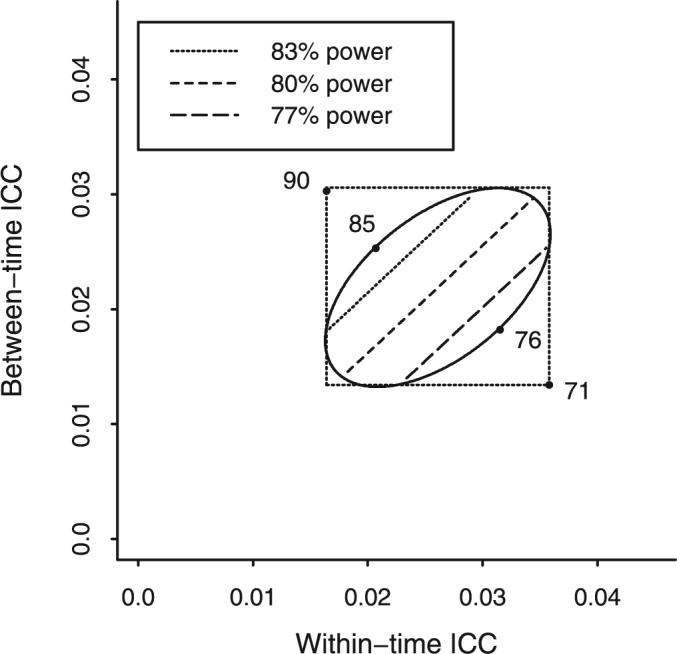
FIGURE 1.

Power for detecting a difference in prevalence of past 30-day alcohol use of 0.10 between control and intervention conditions with a pretest–posttest nested cross-sectional design with n = 48 and m = 15. The diagonal lines indicate pairs of within-time and between-time intracluster correlation values that give a fixed level of power and that are useful values of correlations for planning a future trial as they lie in the ellipse that defines a 95% joint confidence region for the intracluster correlations.
