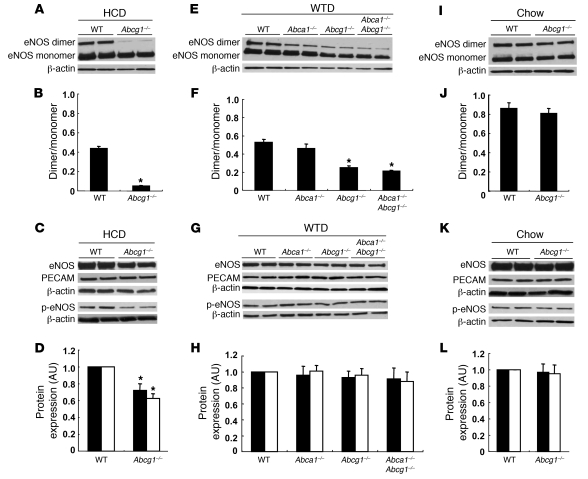
Figure 3. Western blot for eNOS protein of mouse aorta.
(A–D) Aortas from HCD-fed WT and Abcg1–/– mice. (E–H) Aortas from WTD-fed WT, Abca1–/–, Abcg1–/–, and Abca1–/–Abcg1–/– mice. (I–L) Aortas from chow-fed WT and Abcg1–/– mice. (A, E, and I) Western blot for eNOS dimer levels. (B, F, and J) Quantification of eNOS dimer/monomer levels. (C, G, and K) Western blot for eNOS and phospho-eNOS. (D, H, and L) Quantification of eNOS (filled bars) and phospho-eNOS (open bars). The results are represented as mean ± SEM. *P < 0.05 versus control.

