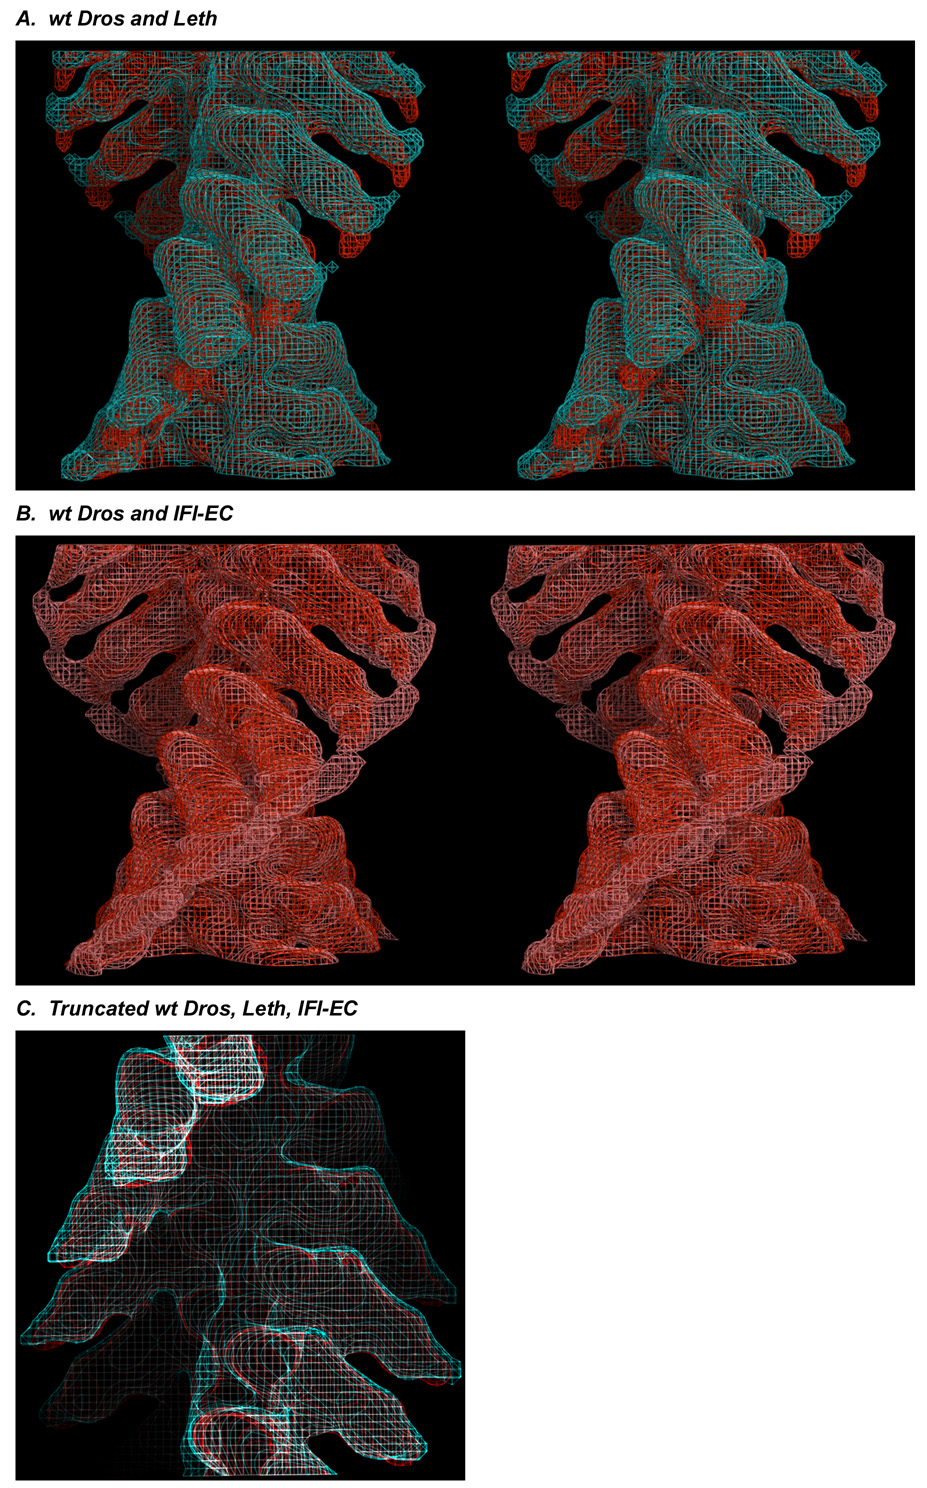
Figure 2.
(A) Stereo, longitudinal view of the wt Dros (red) and Leth (cyan) insect acto-S1 maps superimposed in wire frame. Stereo images were prepared used MacPyMol (DeLano Scientific). Density is identical in the insect maps through the motor domain and the ELC region of the LCD. (B) Comparison of the wt Dros (red) and IFI-EC chimera (pink) maps. When viewed longitudinally, in stereo, a prominent spread of density in the RLC region of the IFI-EC chimera map is apparent. This very noisy “whale tail” suggests the RLC region of chimeric S1 adopts multiple positions. (C). Longitudinal view of the all of the insect maps. The similarity of the insect maps is emphasized by truncating the maps after the ELC omitting the “noisy” RLC region. wt Dros, red, Leth, cyan, IFI-EC, white.

