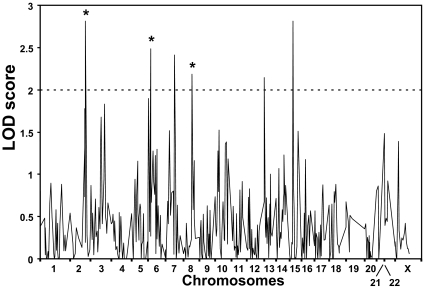
Figure 1.
Whole genome analysis for loci linked with both GD and HT (AITD). The x-axis shows the relative marker positions on each chromosome, and the y-axis shows the LOD score obtained for each marker on every chromosome. Six loci on chromosomes 2q, 6p, 7q, 8q, 13q, and 15q showed evidence for linkage with LOD scores greater than 2.0. However, the LOD score peaks at the 7q, 13q, and 15q loci were narrow, and on multipoint analysis gave nonsignificant LOD scores (Table 2), suggesting that they were false-positive peaks. In contrast, the 2q, 6p, and 8q loci (marked by asterisk) consisted of broad peaks of positive LOD scores and remained significant in the multipoint analysis (Table 2) and therefore are likely to harbor TAb susceptibility genes.

