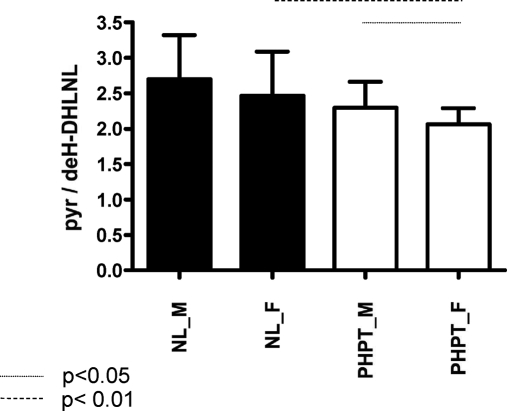
Figure 3.
Dependence of the collagen cross-link ratio in NL and PHPT groups as a function of gender [male (M) and female (F) subjects]. The group means and sds are plotted. Unpaired t test comparisons revealed that whereas there was no difference between the NL-M and NL-F groups, there were statistical differences (P < 0.01) between the NL-F and PHPT-F groups as well as between the M and F PHPT groups.

