
Figure 1.


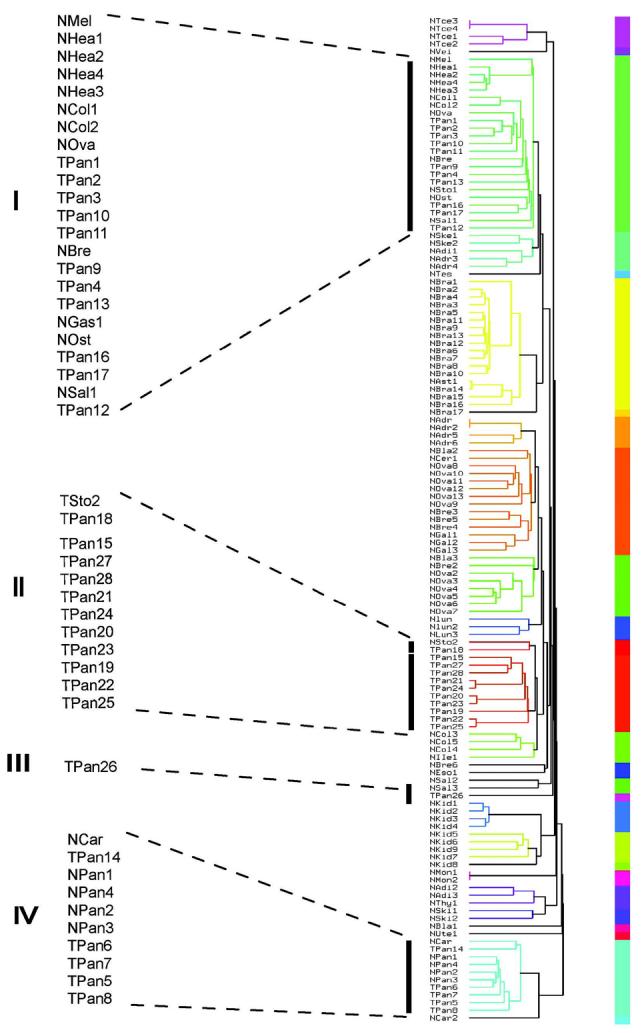
A) Multidimensional scaling plots of the PanAdo tissues (black dots) and normal tissues (gray dots) based on microarray gene expression data. B) Microarray intensity distribution plots of PanAdo samples (dashed line) and normal tissue samples (solid line). Vertical lines show cutoff values for demarcating a gene as either “express” in a given tumor sample (dashed line with a circle) or “not expressed” in a given normal sample (dashed line with a cross). C) Dendrogram of PanAdo tissue groupings with normal tissues based on expression of cell-surface genes. NMel: normal melanocytes; Nhea: Normal heart; NCol: Normal colon; NBre: Nornal breast; NOva: Normal ovary; NOst: Normal osteoblasts; NSal: Normal salivary gland; NSke: Normal skeletal muscle; NAdi: Normal adipose tissue; NAdr: Normal Adrenal gland; NSto: Normal stomach; NCar: Normal cartilage tissue; NPan: Normal pancreas; TPan: Pancreatic adenocarcinoma samples.