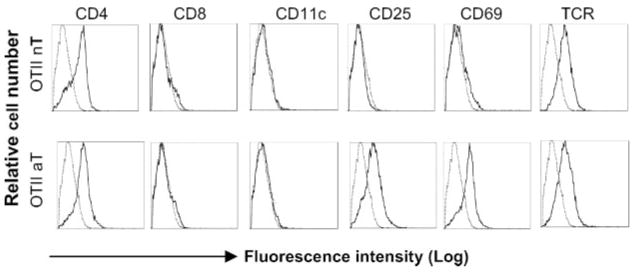
FIGURE 1.
Phenotypic analysis of CD4+ T cells by flow cytometry. Flow cytometric analysis of OT II CD4+ T cells. The nT OT II and aT OT II cells (thick solid lines) were stained with a panel of Abs and then analyzed by flow cytometry. These cells were also stained with isotype-matched irrelevant Abs, respectively, and used as control populations (thin dotted lines). One representative experiment of three is shown.

