FIGURE 2.
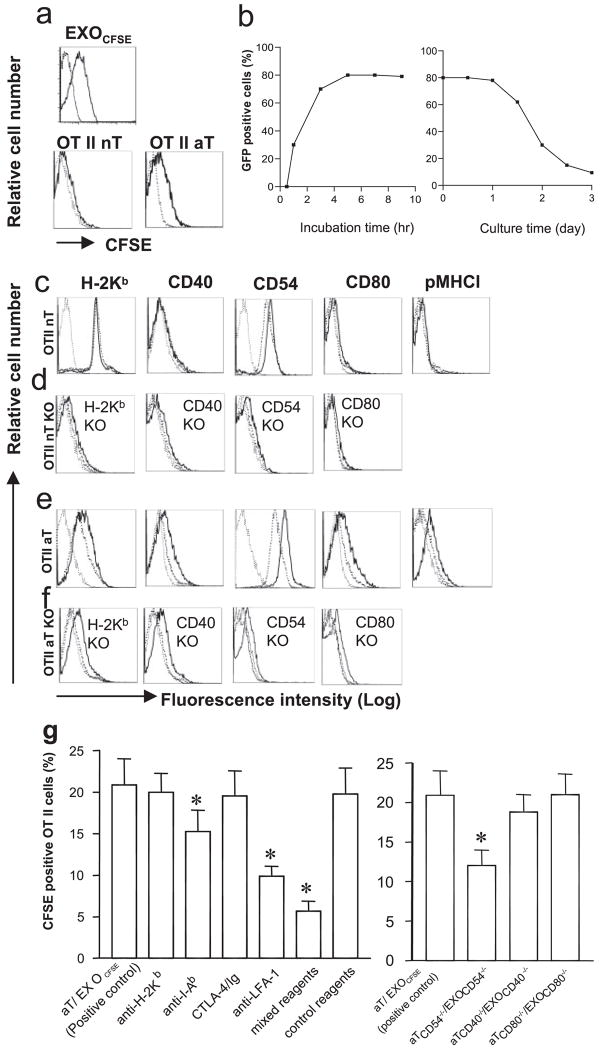
EXO uptake by CD4+ T cells. a, Both naive and active OT II and C57BL/6 CD4+ T cells with (thick solid lines) and without (thin dotted lines) uptake of EXOCFSE were analyzed for CFSE expression by flow cytometry. b, Kinetic study of EXO uptake by CD4+ T cells. Active OT II CD4+ T cells (2 × 10⁶ cells) were incubated with EXOCFSE (20 μg) in DMEM (0.2 ml) containing 10% FCS and IL-2 (10 U/ml) at 37°C for different times. CFSE-positive T cells were detected by fluorescence microscopy and the percentages of CFSE-positive T cells were calculated. In another set of experiments, active OT II CD4+ T cells with incubation of EXOCFSE for 5 h were cultured in DMEM containing 10% FCS and IL-2 (10 U/ml) at 37°C for different times. CFSE-positive T cells were detected by fluorescence microscopy and the percentages of CFSE-positive T cells were calculated. c and e, Both naive and active OT II CD4+ T cells with (thick solid lines) and without (thick dotted lines) uptake of EXOOVA were analyzed for expression of a panel of surface molecules including H-2Kb, CD40, CD54, CD80, and pMHC I by flow cytometry. Irrelevant iso-type-matched Abs were used as controls (thin dotted lines). d and f, Both naive and active OT II CD4+ cells from H-2Kb, CD40, CD54, and CD80 gene KO mice were also cocultured with (thick solid lines) and without (thick dotted lines) EXOOVA and then analyzed for expression of H-2Kb, CD40, CD54, and CD80 by flow cytometry, respectively. Irrelevant isotype-matched Abs were used as controls (thin dotted lines). g, In the blocking assay, OT II CD4+ aT cells were treated with anti-H-2Kb, anti-Iab, and anti-LFA-1 Abs, and CTLA-4/Ig fusion protein, a mixture of these reagents or a mixture of matched isotype Abs (as control reagents) or PBS (as positive control) on ice for 30 min, respectively, and then incubated with EXOCFSE. In addition, OT II CD4+ aT cells with CD54 deficiency were incubated with EXOCFSE derived from CFSE-labeled (CD54−/−) DCOVA. The fractions of CFSE-positive T cells were analyzed after coculture for 5 h at 37°C. *, p < 0.05 vs cohorts of the positive control (aT/EXOCFSE) (Student’s t test). One representative experiment of three is displayed.

