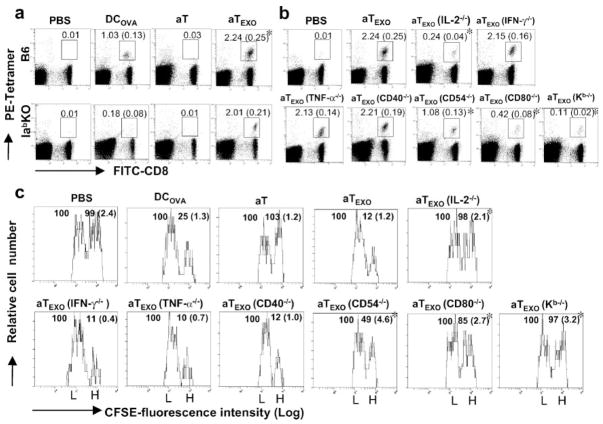
FIGURE 5.
Stimulation of CD8+ T cell proliferation and differentiation into CTL in vivo. Wild-type C57BL/6 or Iab−/− gene KO mice were i.v. immunized with irradiated (a) DCOVA, aT and aTEXO, and (b) aTEXO with various gene KO, respectively. Six days after immunization, the tail blood samples of immunized mice were incubated with PE-H-2Kb/OVAI tetramer and FITC-anti-CD8 Ab (Beckman Coulter) according to the company’s protocol, then analyzed by flow cytometry. The value in each panel represents the percentage of tetramer-positive CD8+ T cells vs the total CD8+ T cell population. The value in parentheses represent the SD. *, p < 0.05 vs cohorts of the positive control (aT/EXO) (Student’s t test). c, In an in vivo cytotoxicity assay, the above immunized mice were i.v. coinjected at a 1:1 ratio of splenocytes labeled with high (3.0 μM, CFSEhigh) and low (0.6 μM, CFSElow) concentrations of CFSE and pulsed with OVAI and Mut 1 peptide, respectively, 6 days after immunization with aT, aTEXO, and aTEXO with various gene KO, respectively. Sixteen hours after target cell delivery, the residual CFSEhigh and CFSElow target cells remaining in the recipients’ spleens were sorted and analyzed by flow cytometry. The value in each panel represents the percentage of CFSEhigh cells vs CFSElow cells remaining in the spleens. *, p < 0.05 vs cohorts of the positive control (aT/EXOCFSE) (Student’s t test). One representative experiment of three in the above different experiments is shown.

