FIGURE 6.
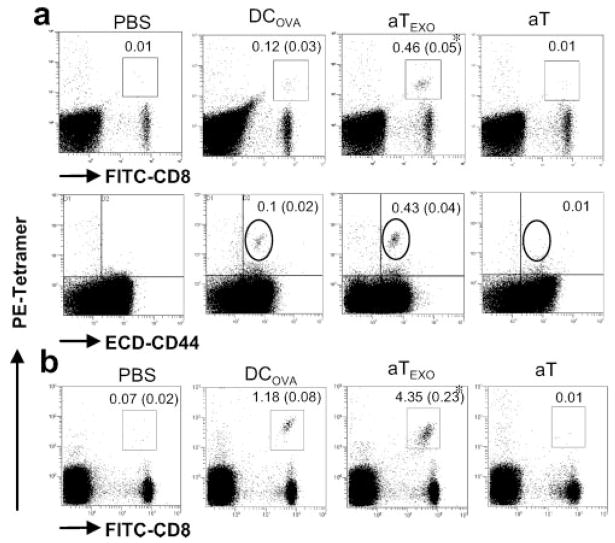
Development of Ag-specific CD8+ memory T cells. a, C57BL/6 mice were immunized with irradiated DCOVA and aTEXO, respectively. Three months later, the tail blood was taken from these immunized mice and stained with PE-H-2Kb/OVA tetramer, FITC-anti-CD8 and ECD-anti-CD44 Abs, and analyzed by flow cytometry. The value in each panel represents the percentage of tetramer-positive CD8+ T cells vs the total CD8+ T cell population. The value in parentheses represents the SD. The PE-tetramer- and FITC-CD8-positive cells in the squares were sorted and analyzed, showing they were also PE-tetramer- and ECD-CD44-positive cells in the circles. *, p < 0.05 vs cohorts of the positive control (DCOVA) (Student’s t test). b, The above immunized mice were boosted with DCOVA. Four days after the boost, the recall responses were examined using staining with PE-H-2Kb/OVA tetramer and FITC-anti-CD8 Ab and analyzed by flow cytometry. The value in each panel represents the percentage of tetramer-positive CD8+ T cells vs the total CD8+ T cell population. The value in parentheses represents the SD. The results presented are representative of five separate mice per group. One representative experiment of three is shown.

