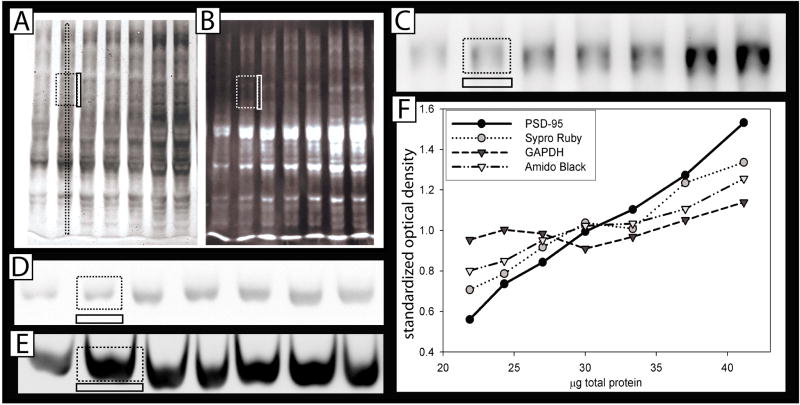
Figure 1. Quantification of relative abundance using Western Blotting.
Serial dilutions (21.9, 24.3, 27, 30, 33, 37 and 41μg of protein) derived from mouse cortex were run on SDS polyacrylamide gels. Large dotted rectangles represent quantified area (both a long strip or a smaller rectangle worked sufficiently to quantify total protein). Smaller, solid adjacent rectangles represent subtracted background, either between the lanes (for total stains) or below the bands (for single proteins). A: Amido black total protein stain, B: SYPRO® Ruby total protein stain, C: Representative blots stained with anti-PSD-95 D: anti-GAPDH (Santa Cruz.) and E: anti-GAPDH (sigma). F: Optical density at each protein concentration averaged over 10 blots, showing the different “relative abundance” slopes determined using each potential loading control. (β-actin and pERK were omitted for clarity, and because they were represented on <10 blots.) These data were examined statistically in figure 2B.

