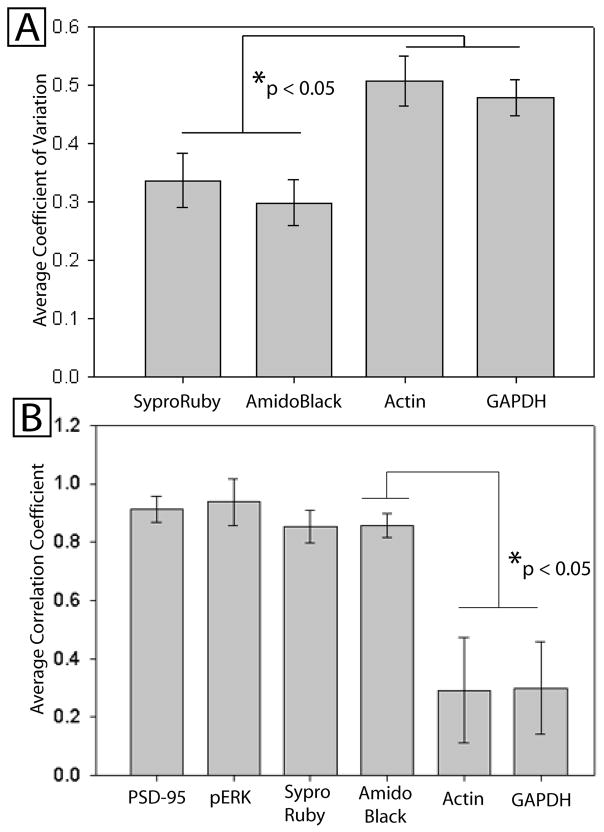
Figure 2.
Serial dilutions between 21.9 and 41μg of protein homogenate were loaded in duplicate on each blot and stained both for the protein of interest (PSD-95) as well as each potential loading control. Relative optical density of the stain was used as a measure of abundance. A: The Average Coefficient of Variation (COV) of the “relative abundance” derived from the measure of PSD-95 normalized to each loading control. The COV is the standard deviation divided by the average normalized optical density, and should be low when the loading control accurately reflects loaded differences. There was an overall difference in COV based on loading control (F=5.6, p<0.01). B: The average correlation (over all blots) between the known amount of loaded protein and measured optical density of the loading control. There was an overall difference in correlation coefficients by loading control (F=10.4, p<0.001). Post hoc findings corrected for multiple comparisons are shown for both graphs.

