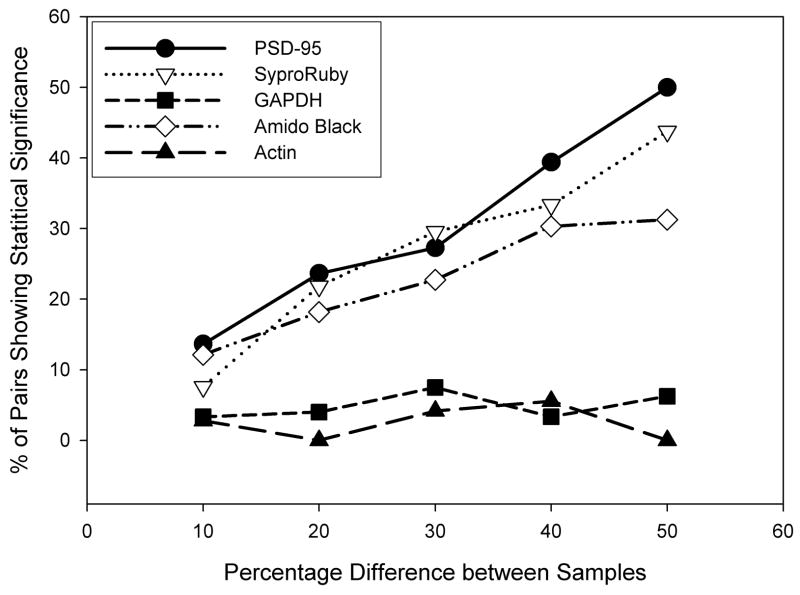
Figure 3. Total protein stains are better than high-abundance loading controls at detecting known differences in protein level.
The x-axis indicates the known concentration difference (ranging from 10–50%) between individual lanes containing serial dilutions, in order to test for the ability to determine these differences experimentally. The y-axis depicts the percentage of possible pairs that, within a blot, were able to demonstrate a statistical difference (in the correct direction) between concentrations run in duplicate (p < 0.05).

