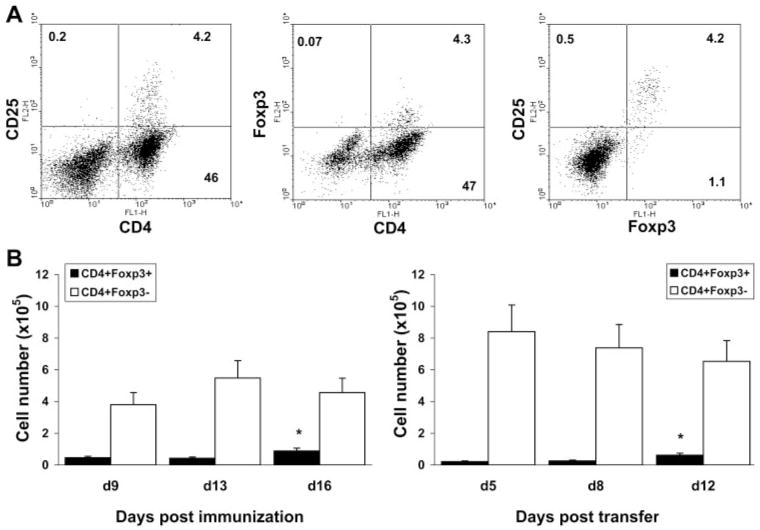
Figure 2.
Ocular CD4+CD25+ cells expressed FoxP3. Ocular cells from m-EAU and r-EAU rats were analyzed by flow cytometry for expression of FoxP3 and CD25. (A) Representative plots from ocular infiltrating cells of r-EAU rats stained with mAbs for CD4/CD25, CD4/Foxp3, and CD25/Foxp3. (B) Numbers of CD4+FoxP3+ cells in eyes over time in m-EAU (left) and r-EAU (right) rats. Data were obtained from three experiments and analyzed by one-way ANOVA and Tukey post hoc analysis. The CD4+Foxp3+ cell number in the recovery phase was significantly different from that at the onset or peak of disease (*P < 0.01).

