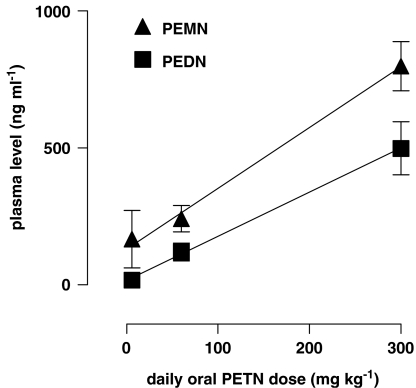
Figure 3.
Plasma levels of the pentaerythrityl tetranitrate (PETN) metabolites PETN dinitrate (PEDN) and mononitrate (PEMN) detected in PETN-treated mice. The concentrations of both metabolites increased significantly with increased PETN dose in a directly proportional manner; r2 is 0.5606 for PEDN (significant deviation from 0, P=0.0013) and 0.7374 for PEMN (P<0.0001, n=7). All values represent mean±s.e.m.

