
Table 1.
In vitro activity data for BI-78D3 and related compounds
| Molecule | ID | MW | DELFIA assay data | LanthaScreenTM kinase assay data |
|---|---|---|---|---|
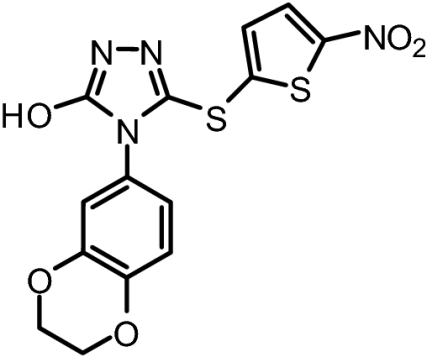
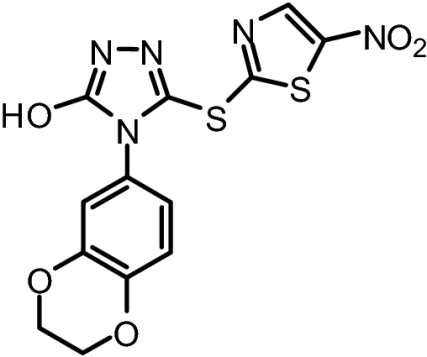 |
BI-78D3* | 379.37 | IC50 = 500 nM | IC50 = 280 nM |
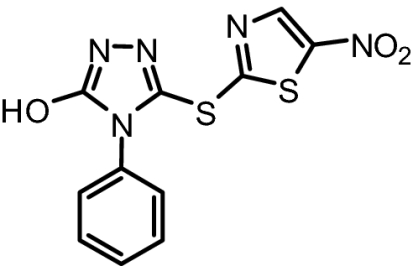 |
BI-83C9 | 321.33 | IC50 = 237 nM | IC50 = 3.1 μM |
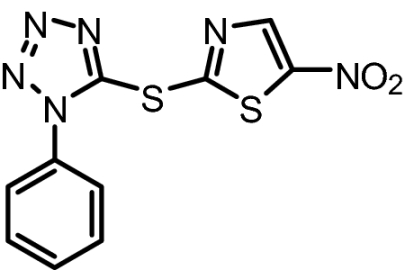 |
BI-83C7 | 306.32 | IC50 = 183 nM | IC50 = 3.3 μM |
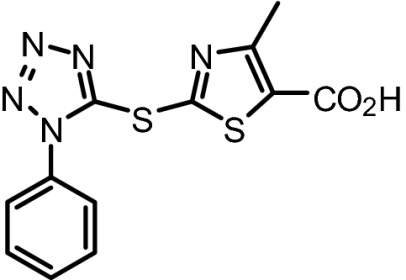 |
BI-83C8 | 319.36 | IC50 = 7.5 μM | No Inhibition at 100 μM |
 |
BI-83B3 | 268.33 | No Displacement at 25 μM | No Inhibition at 100 μM |
 |
BI-83C11 | 378.38 | No Displacement at 25 μM | No Inhibition at 100 μM |