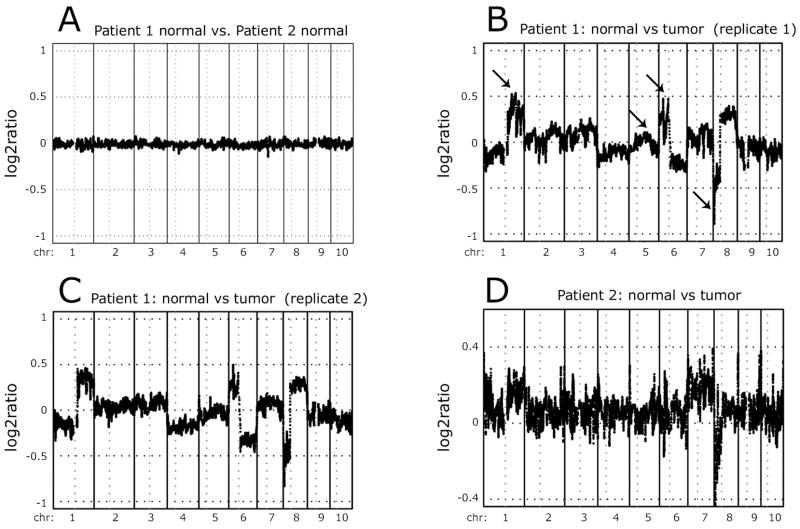
Figure 4. Analysis of copy number changes in HCC samples.
vCGH analysis was performed comparing the normal DNA from both patients (A), the tumor vs. normal DNA from two separate ChIP-chip experiments for patient 1 (B, C), and the tumor vs. normal DNA for patient 2 (D). The y axes indicate the log2 ratio of the tumor to normal signals. Values above 0 represent copy number gains in the tumor and values below 0 represent copy number losses in the tumor. In panel B, the arrows indicate several of the amplified (chromosome 1q and 6p), deleted (chromosome 8p), or control (chromosome 5q) regions analyzed in Figure S6.

