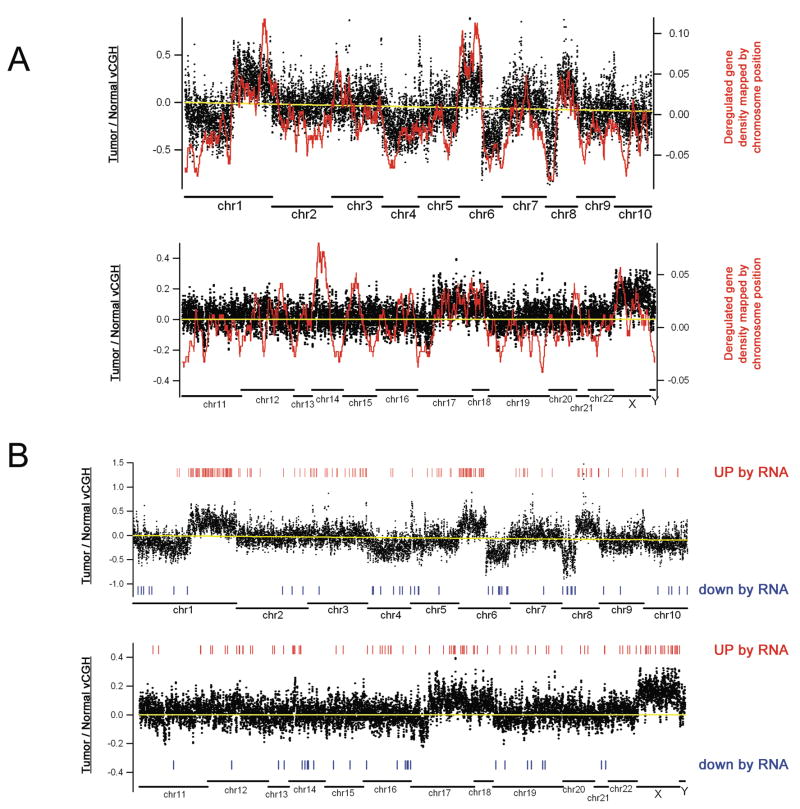
Figure 6. Mapping deregulated RNAs onto the vCGH pattern.
(A) The mRNAs that are upregulated or downregulated in patient 1 are shown as a density plot in relation to the vCGH pattern from the same patient. Deregulated mRNA density was calculated based on chromosomal location by a sliding-window average algorithm. Positive values on the right Y axis represent up-regulated genes and negative values represent down-regulated genes. (B) The mRNAs that showed increased or decreased copy number in both patient 1 and patient 2 are mapped regulative to the vCGH pattern of patient 1.

