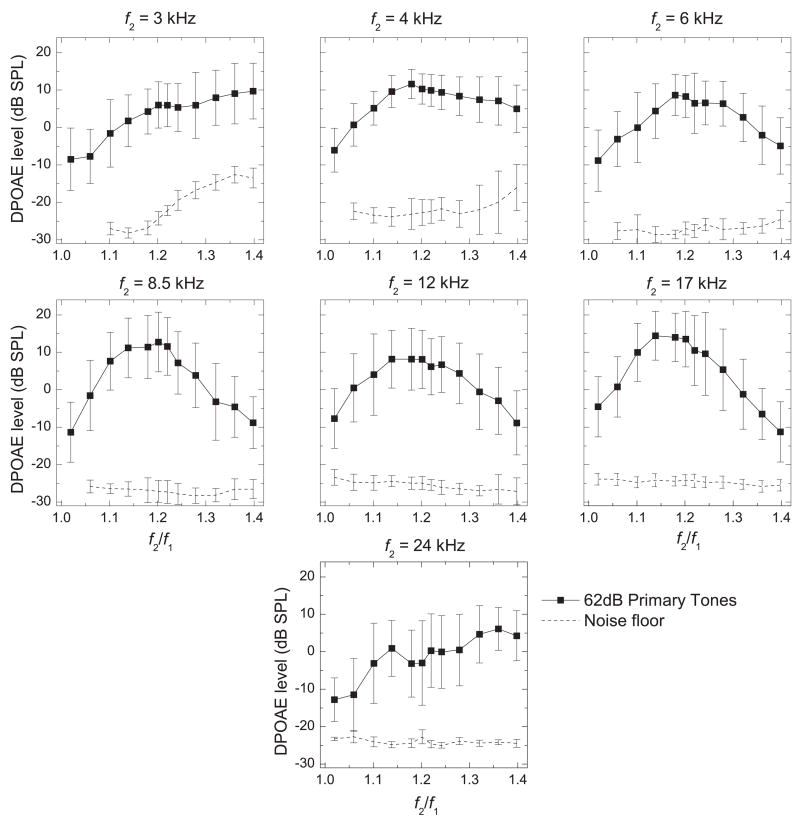
Figure 2.
Frequency-ratio (f2/f1) functions for each f2 frequency (axes as in Fig. 1). The DPOAEs shown here were obtained using equilevel primary tones at 62 dB SPL and were averaged across all animals and ears. Error bars are shown to demonstrate the typical amount of inter-subject and inter-ear variability observed in the DPOAE levels and the noise floor.

