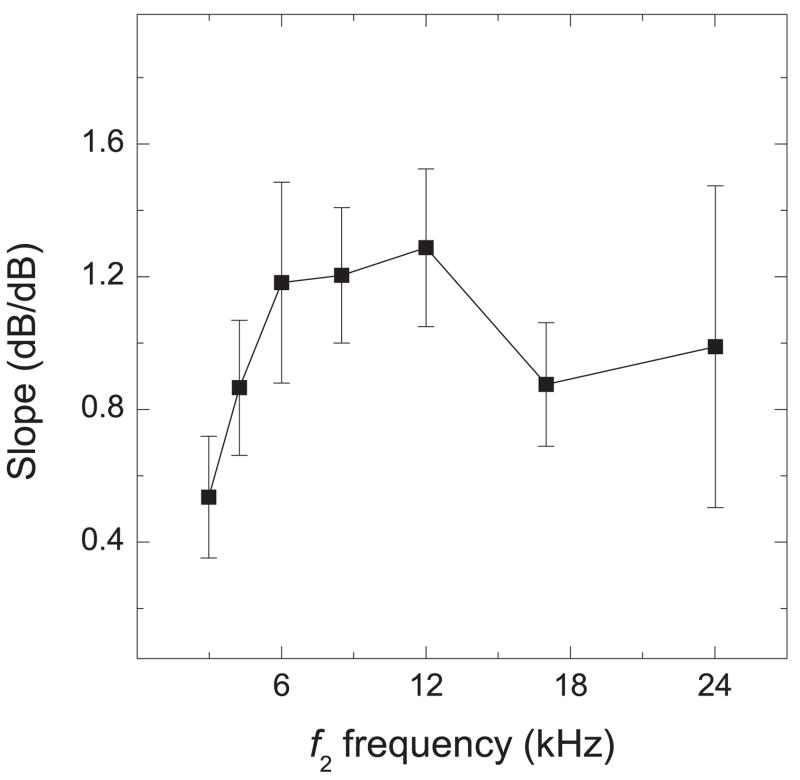
Figure 9.
Slope Functions (Slope vs. f2 frequency). The slopes of the linear-regression equations characterizing the I/O functions from 50 – 68 dB SPL (averaged across all ears of both sexes). Error bars are shown to indicate the amount of inter-subject and inter-ear variability in the slope of the I/O functions.

