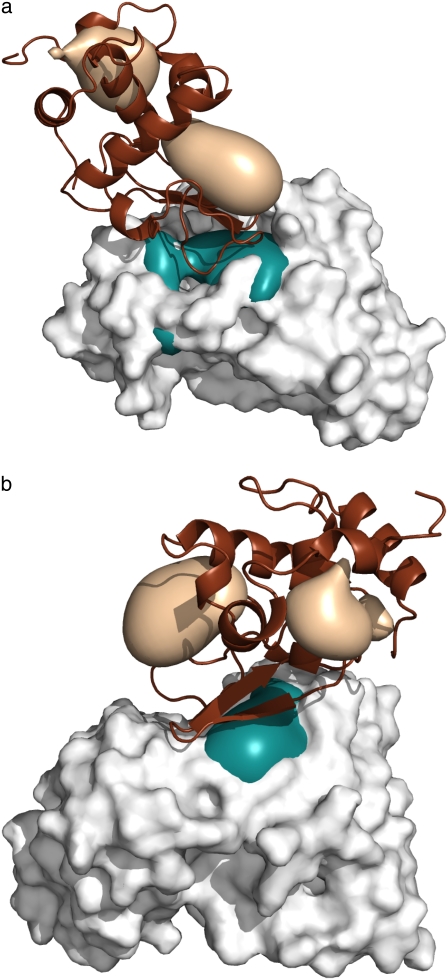
FIGURE 4.
Patches of maximum hydrophobicity in antigen-antibody complexes. (a) Hyhel-5 Fab antibody fragment in complex with chicken lysozyme (PDB code 1BQL). (b) Monoclonal antibody Fab D44.1 in complex with chicken lysozyme (PDB code 1MLC). In both panels the antibody fragment is shown as the white solid model, with teal patches representing the regions with maximum hydrophobicity. The lysozyme is shown as a brown cartoon, with light brown patches as regions of maximum hydrophobicity. In both figures the antibody CDRs are oriented upward, showing that the CDR regions include strongly hydrophobic patches, but these do not interact with regions of maximum hydrophobicity on the lysozyme.

