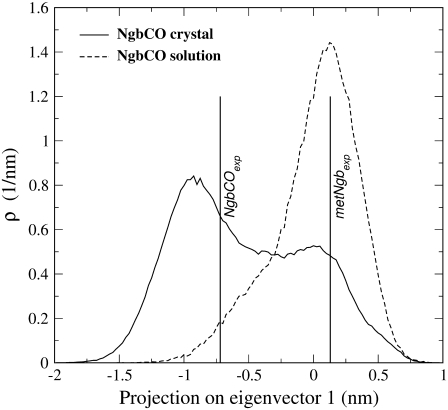
FIGURE 2.
Heme displacement distributions along its first essential eigenvector in carboxy Ngb in the crystal (solid line) and in solution (dashed line). The values corresponding to the experimental heme positions in carboxy Ngb (−0.72 nm) and metNgb (0.13 nm) in the crystal are indicated by vertical bars. Note that, with a single value in the abscissa, the distribution converges to a Dirac function.

