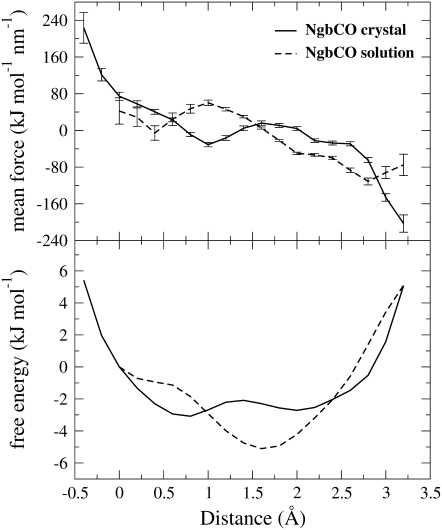
FIGURE 3.
Mean force with their standard deviations (upper panel) and heme group free energy landscape (bottom panel) for carboxy Ngb in the crystal (solid line) and in solution (dashed line). In brief, the method is based on the choice of a direction and on the calculation of the mean force acting on the heme center of mass along this direction. The mean force corresponds to the free energy gradient.

