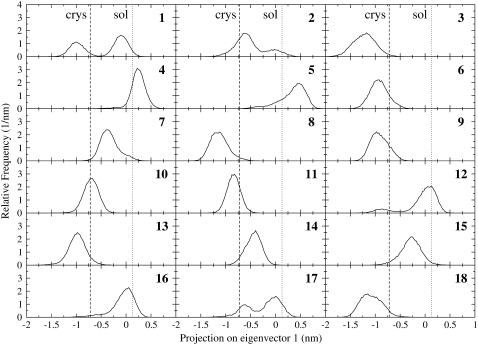
FIGURE 4.
Heme displacement distributions along its first essential eigenvector in the carboxy Ngb crystal. The distributions are shown for each protein molecule in the crystal unit cell (1–18). The vertical lines represent the principal configurations detected in the crystal (dashed line) and in solution (dotted lines).

