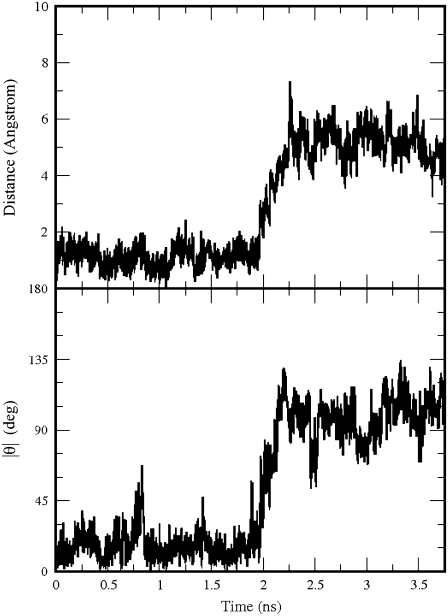
FIGURE 5.
The distance of the GABA center of mass from its position at the beginning of the production run (top) in the GABAC receptor; the modulus of the angle θ between the lines passing through the GABA amine nitrogen and the GABA center of mass at the beginning and at a generic time of the production run (bottom).

