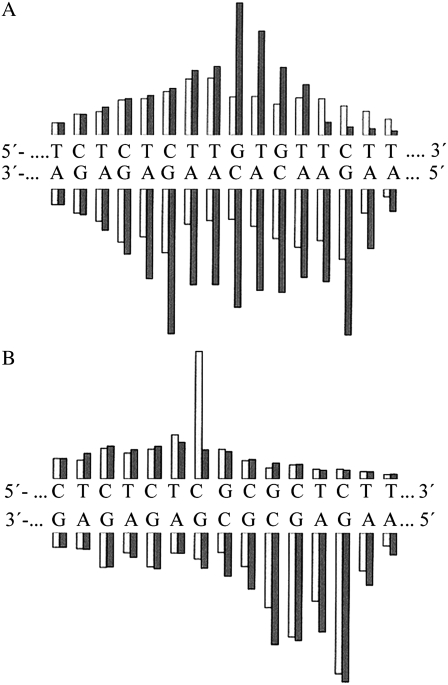
FIGURE 3.
Quantitation of Op-Cu digestion of TGTGT (A), CGCGC (B) duplexes, and their analogs containing a single, site-specific 1,3-GNG intrastrand cross-link. The autoradiograms (not shown) were quantitated by microdensitometry. The black bars represent digestion of the unplatinated duplexes, and the light bars represent digestions of the platinated duplexes. The heights of the bars are proportional to the band intensities on the autoradiograms.

