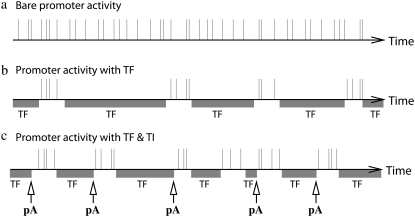
FIGURE 3.
Schematic diagrams for the time sequence of a promoter activity for a bare promoter (a), a promoter with TF regulation (b), and a promoter with TF under TI (c). The vertical lines represent the times when transcriptions are initiated. The shaded intervals labeled as TF represent the time intervals when a TF bounds to the operator site, thus the promoter cannot initiate transcription. Under the TF regulation, the transcription bursts take place when a TF does not bind. The arrows indicate the times when interfering RNAPs from pA arrive at pS and remove both TF and RNAP at pS; TI triggers transcription bursts.

