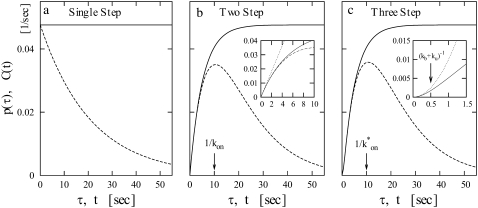
FIGURE 4.
The interval distribution p(τ) (dashed lines) and the time-dependent elongation rate C(t) (solid lines) for the single-step (a), the two-step (b), and the three-step model (c). The parameters for the three-step model are kb = 1 s−1, ku = 1 s−1, ko = 0.2 s−1, and ke = 0.1 s−1, which gives the average elongation rate Ω0 = (1/kb + 1/ + 1/ke)−1 = 1/21 s−1 and the effective on-rate
  ≡ ko/(1 + ku/kb) = 0.1 s−1. The parameters for the two-step model are determined so that they behave similarly, i.e., the on-rate kon =
  and the elongation rate in the on-state
  for the two-step model given by
  = (1/Ω0 – 1/
 )−1. The insets show the behaviors at t ≈ 0 with the asymptotic curves (dotted lines).

