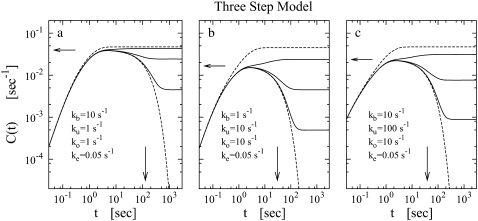
FIGURE 6.
The time-dependent activity profile C(t) with TF for the three-step models. For each case, we show five lines: the un-repressed case without TF (top, dashed lines); the repressed cases by TF with the binding rate  and the unbinding rate
  s−1 (top, solid lines); 0.01 s−1 (middle, solid lines); 0.001 s−1 (bottom, solid lines); and with TF that never unbinds (bottom, dashed lines). The arrows indicate Cmax given by Eq. 34 and tpl given by Eq. 30. For all cases, the bare activity is Ω0 ≈ 0.05 s−1, but we focus on the promoters with fast open complex formation, namely, the larger effective on-rate
  = 10/11 s−1. The case in panel a corresponds with a strong closed complex binding ku/kb ≪ 1, whereas panels b and c deals with a weakly binding RNAP. The difference between panels b and c illustrates the effect of a 10-times faster RNAP binding rate to the promoter.

