FIGURE 3.
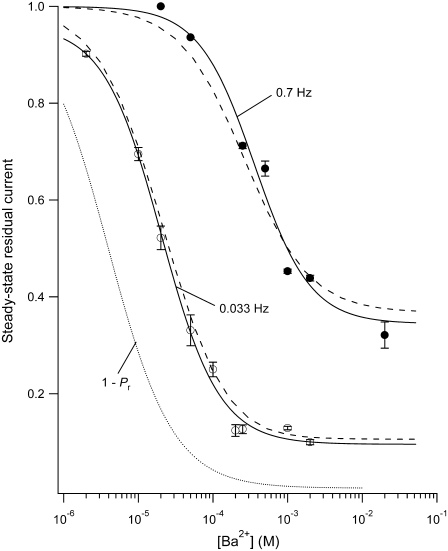
The steady-state level of Ba2+ block is dependent on the stimulation frequency and the [Ba2+]. Test pulses to +50 mV for 10 ms were applied at either 30-s intervals (0.033 Hz (open circles)) or 1.43-s intervals (0.7 Hz (solid circles)) with 0  and a pHo of 7.4. Ba2+ was applied at various concentrations using a computer-controlled fast perfusion system. The steady-state residual current (1 − proportion of blocked (PB,SS)) at the end of the test pulse was normalized to the control test current before Ba2+ application and plotted against the concentration of Ba2+ applied (2 μM – 20 mM). The black solid lines represent the best fits of the two data sets to the Hill equation. Estimates of the apparent KBa,d and the Hill coefficient are 20.3 ± 2.6 μM and 1.12, respectively, for the data collected at 0.033 Hz, whereas the estimates from the 0.7 Hz data are 361 ± 151 μM and 1.16, respectively. Gray dashed lines represent the outcome of a simultaneous fit of the two data sets to Eq. 4. From the fit, k2, KBa,s, k−2, and τd were estimated to be 0.15 s−1, 0.8 mM, 0.0006 s−1, and 59 ms, respectively (see text). The dotted gray line represents the solution for the residual normalized current (1 − Pr), where Pr is the proportion of channels blocked after a prolonged rest at the holding potential, i.e., at 0 Hz. A fit of 1 – Pr to the Hill equation gave a Hill coefficient of 1 and a KBa,d of 4 μM, indicating that the apparent KBa,d is profoundly affected by the pulse frequency. Data points are from a total of 29 cells (2–8 cells/point) for the 0.7 Hz data; and 45 cells (3–9 cells/point) for the 0.033 Hz data.

