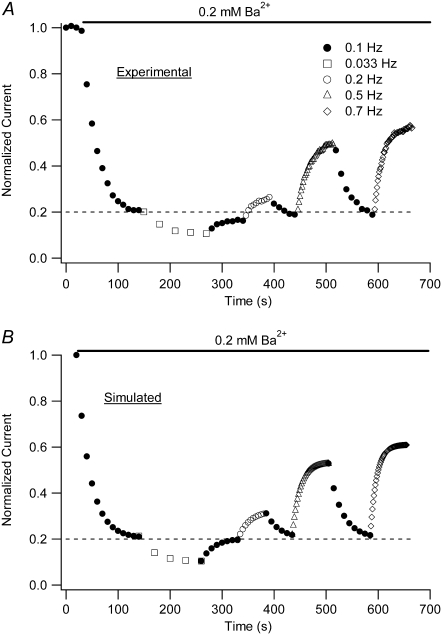
FIGURE 4.
A model of the frequency-dependent Ba2+ binding replicates the time dependence of block onset and reversal. (A) A representative experiment in which a cell was given four 10-ms test pulses to +50 mV in 0 mM Ba2+ before a rapid changeover to 0.2 mM Ba2+ while test pulses continued to be applied at 0.1 Hz (open circles). After steady-state block was achieved, the pulse frequency was decreased to 0.033 Hz (open squares) and the block was allowed to reach a new steady state. The enhanced steady-state block observed with 0.033-Hz stimulus frequency was reversed upon reverting to 0.1-Hz pulses. The effects of changing the pulse frequency to 0.2 (○), 0.5 (Δ) and 0.7 (◊) Hz were subsequently examined using the same approach. Data points show current amplitudes normalized to the peak current at the end of the initial control test pulses. (B) Plot of simulated proportion of residual normalized current (1 – PB,x) at the end of each test pulse shown in A, calculated using Eq. 5 and the values for k2, KBa,s,, k−2, and τd derived from fits to the data of Fig. 3. The values for td, tr, and τr were those derived from Fig. 3 (see text), whereas Pinitial of Eq. 5 is 1 − the proportion of current at the end of the preceding pulse train. At each stimulus frequency, the numerical simulation provides a good estimate both of the steady-state level of block and the time course of the relaxation to that steady state.

