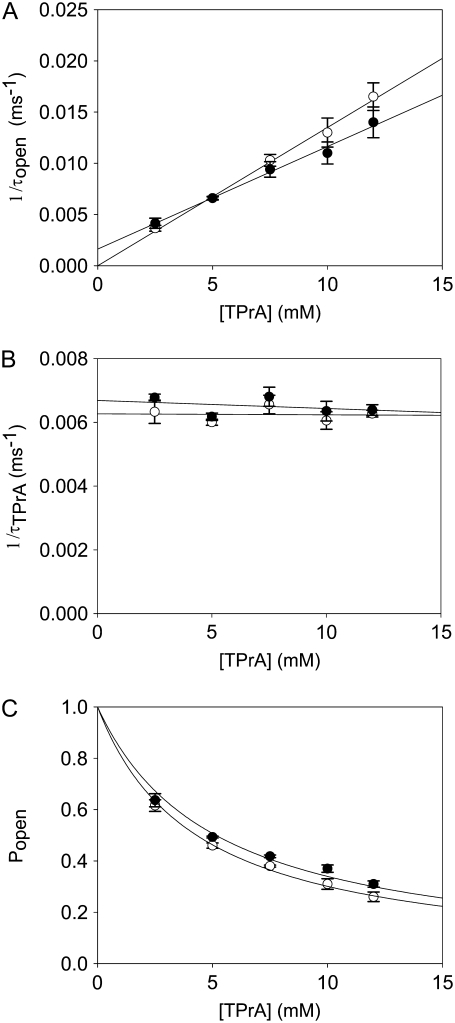
FIGURE 4.
Kinetic analysis for TPrA in the presence of R13Q, carried out as in the previous figure. (A) The reciprocal of open time of TPrA (τopen) as a function of TPrA concentration. (B) The reciprocal of closed time of TPrA (τTPrA) as a function of TPrA concentration. (C) Measured probability that the channel is not occupied by TPrA (Popen) as a function of [TPrA]. Data points and error bars in A–C are the mean ± SD for three to four different single Na channels at each concentration of TPrA. (○) Data when channel was not bound by R13Q from extracellular side; (•) data when channel was bound by R13Q from extracellular side. The solid lines in A are fits to Eq. 2, which were used to measure the association rate constants, kon. The solid lines in B linear fits to the means of determinations of the dissociation rate constants, koff (Eq. 3) from five channels. The solid lines in C are fits to Eq. 4, used to measure the equilibrium dissociation constants  Asterisks (*) denote a significant difference (t-test, p < 0.05).

