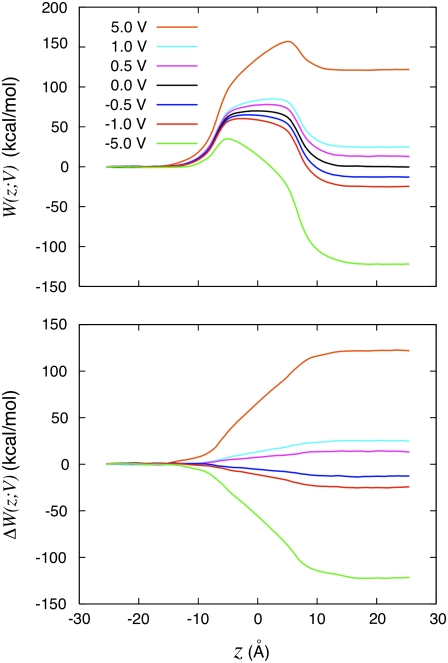
FIGURE 3.
Potential of mean force analysis. (Top) Calculated PMF W(z;V) for a K+ ion along the z axis of the system shown in Fig. 2 at various transmembrane potentials. The PMFs were calculated by integrating the mean force acting on the K+ held fixed at a series of positions along the z axis. All the PMFs were offset to be equal to zero at z = −20 Å. The results for −5.0, −1.0, and −0.5 were reconstructed from the results with 5.0, 1.0, and 0.5 V by symmetry (i.e., using the property that W(z;V) → W(−z; −V) + B, where B is an offset constant). (Bottom) Perturbative effect of the applied voltage obtained by subtracting the PMF at zero voltage from all the other PMFs, ΔW(z;V) = W(z;V) – W(z;0). The color legend is 5.0 V (orange), 1.0 V (cyan), 0.5 V (magenta), 0.0 V (black), −0.5 V (blue), −1.0 V (red), and −5.0 V (green).

