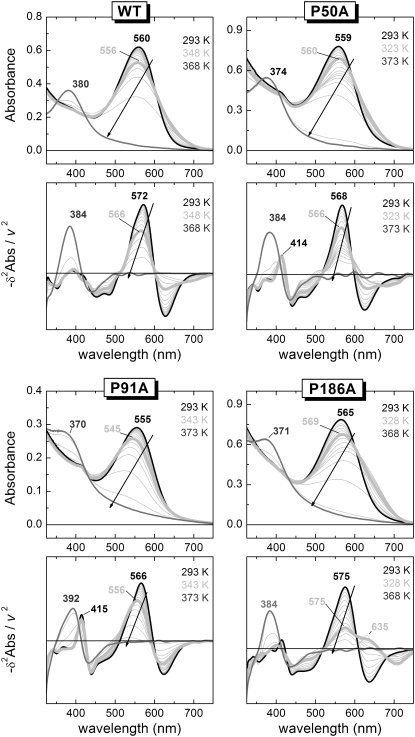
FIGURE 4.
Denaturation of the bR active site monitored by UV-vis spectroscopy. The upper panel of each indicated protein (WT or mutant) corresponds to the original spectra showing the absorbance changes as a function of wavelength and temperature. The lower panel for each indicated protein (WT or mutant) depicts the plot of the minus second derivative of the absorbance versus the wavelength at the measured temperatures. In the second derivative, irrelevant and undesirable baseline features are strongly removed, helping the visualization of the relevant spectral information. Moreover, the narrowing of the bands, allowed us to distinguish between spectral shift and band broadening, facilitating the identification of the initial state (thick black spectra), the intermediate state (thick light gray spectra), and the final state (gray spectra). The arrows in the plot indicate the direction of the main band in the thermal reaction.

