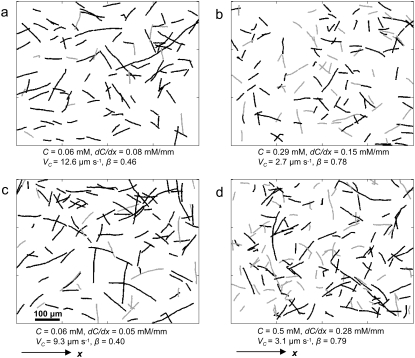
FIGURE 2.
Digitized trajectories of E. coli corresponding to different combinations of chemoattractant concentration C and concentration gradient dC/dx. Concentration increased along x. Black (gray) trajectories had a net positive (negative) displacement in the direction of the gradient and contributed to the total cumulative time T+ (T−) cells spent traveling up (down) the gradient. (a and c) C ≪ KD (KD = 0.125 mM): most cells had swum up the gradient, resulting in a small swimming direction asymmetry β and a large chemotactic velocity VC. (b and d) C ≫ KD: receptors saturated, chemotaxis diminished, and trajectories were nearly equally partitioned between up and down the gradient.

