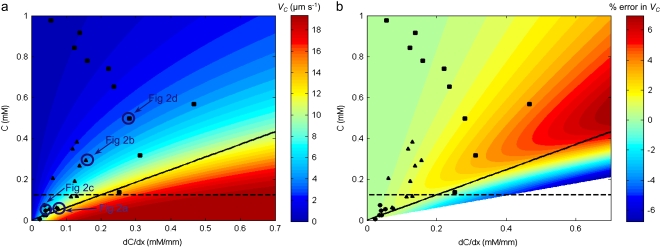
FIGURE 6.
(a) The chemotactic velocity VC of E. coli exposed to α-methylaspartate as a function of the concentration C and concentration gradient dC/dx. VC was calculated from Eq. 9 using the experimentally determined values v2D = 29.8 μm s−1 and χ0 = 12.4 × 10⁻⁴ cm2 s−1. Symbols represent the experimental runs, separated based on initial chemoattractant concentration (•: C0 = 0.1 mM; ▴: C0 = 0.5 mM; ▪: C0 = 1.0 mM). Bacterial trajectories corresponding to four cases (circled symbols) are shown in Fig. 2. The dashed line indicates C = KD. The solid line represents C = (dC/dx) × v1D/acrit (with v1D = v3D/2 = 19 μm s−1 and acrit = 0.03 s−1 (52)). The parameter space below this line represents experimental conditions for which saturation of the adaptation response is expected (52). Only two points fall below the saturation line. (b) The error incurred in estimating VC (Eq. 9) using the mean nutrient concentration C over the entire field of view, expressed as a percentage deviation from the average VC calculated for a linearly varying concentration profile, as a function of C and dC/dx. Symbols and lines as in (a). The error is <4% for all experiments. In the white region comparison with a linear concentration scenario is not possible, as it would correspond to negative concentrations.

