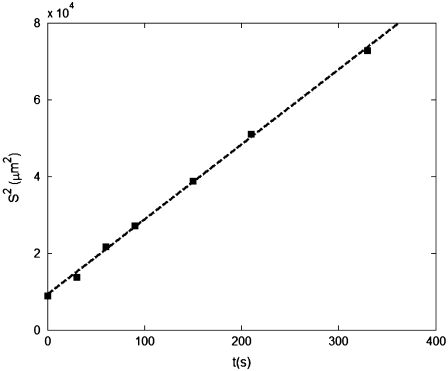
FIGURE 8.
The squared standard deviation S2 of the across-channel bacterial distribution corresponding to the experiments in Fig. 7 d, as a function of time t elapsed since release of the bacterial band. The dashed line represents the best linear fit, and its slope is 2μ. This experiment yielded μ = 3.6 × 10⁻⁶ cm2 s−1. The average random motility over nine experiments was μ = 3.3 × 10⁻⁶ cm2 s−1.

