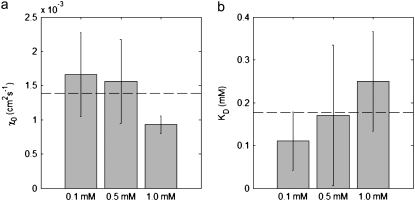
FIGURE 9.
Simultaneous determination of (a) χ0 and (b) KD, obtained by the nonlinear fitting of Eq. 9 to the experimental data for the initial conditions C0 = 0.1, 0.5, and 1.0 mM. The dashed line represents the mean of the three sets of experiments, and the error bars indicate 95% confidence intervals.

