FIGURE 5.
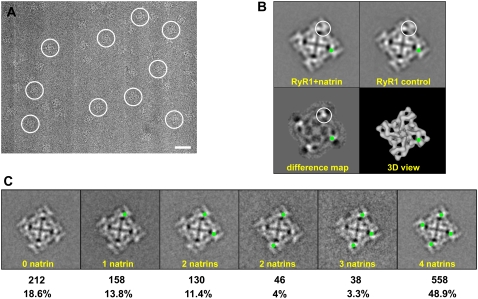
Cryo-electron microscopy and two-dimensional analysis. (A) Portion of cryo-EM micrograph of RyR1 + natrin complexes, showing individual complexes embedded in a thin layer of vitreous ice. The tetrameric structure of RyR1 is well-preserved. Several individual particles are marked with white circles. Scale bar, 500 Å. (B) Two-dimensional averages of top views of RyR1 control and RyR1 + natrin. Two-dimensional top view of RyR1 + natrin was averaged from 245 particle images, and two-dimensional top view of RyR1 control was averaged from 266 particle images. The difference map was obtained by subtracting the RyR1 control average from the RyR1 + natrin average. Top view represents the projection of RyR1 as seen from the cytoplasmic side, as depicted in a reference image of the three-dimensional structure. The largest differences shown in the difference map, corresponding to additional masses contributed by the binding of natrin molecules, are seen as density-maxima bright white areas, and are encircled. The corresponding location of major difference in the difference map is also highlighted by green dots. The width of each frame is 544 Å. (C). Partial occupancy of natrin-binding sites on RyR1 particles. Green dots represent binding sites occupied with natrin molecules (see text for details).

