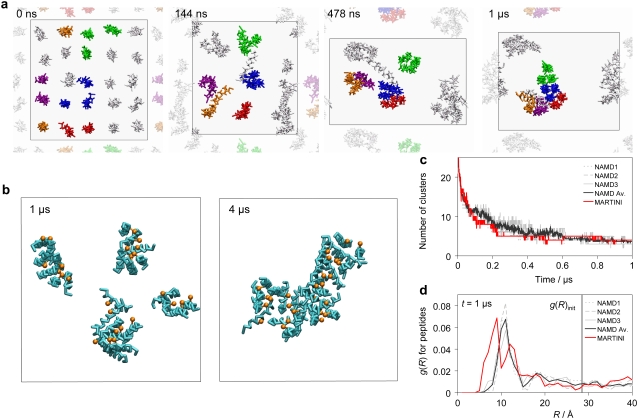
FIGURE 2.
Peptide aggregation. (a) Peptide aggregation from one of the NAMD CG simulations, the other CG simulations show similar aggregation patterns. Snapshots taken at 0 μs, 0.144 μs, 0.478 μs, and 1 μs, respectively. The membrane is shown from the top view with only the peptides drawn. Peptides are colored to illustrate the aggregation mechanism. The neighboring unit cells are partially shown using a dimmer representation. Note the change of the aspect ratio of the periodic box, indicated by a black line, during the simulation. (b) Peptide aggregation in the MARTINI CG simulation. Peptide backbone in cyan with Gln7 side chains in orange. The periodic box is indicated by a black line. Clusters at t = 1 μs and t = 4 μs. (c and d) Peptide aggregation in the CG simulations. NAMD1-NAMD3 are the three NAMD CG simulations with NAMD Av. being the average of the three. MARTINI is the MARTINI CG simulation. (c) Number of peptide clusters over time. (d) Radial distribution of the peptides at t = 1 μs. The solid vertical line indicates the interpeptide distance in the initial (t = 0) structure.

