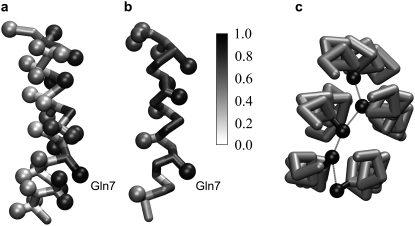
FIGURE 4.
(a and b) Alamethicin colored according to the propensity of individual residues in participating in interpeptide contacts in the lipid bilayer calculated over the period t = 0.8–1 μs. A probability of 1 represents contact at all times and 0 is no contact at any time. (a) An average of the three NAMD CG simulations. (b) The MARTINI CG simulation. (c) Example of clustering of Gln7 residues (black spheres) through a hydrogen bond network, taken from one of the NAMD CG simulations.

