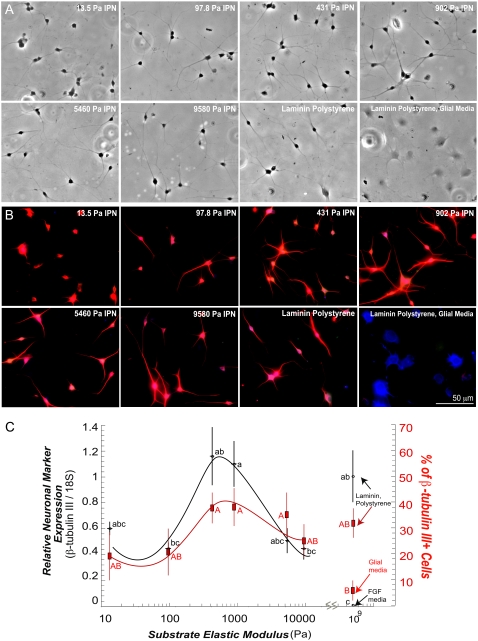
FIGURE 5.
The aNSCs differentiate on vmIPNs into neurons at ∼500 Pa. (A) Phase-contrast images of aNSCs differentiated under neuronal differentiation conditions (1 μM retinoic acid and 5 μM forskolin). On ∼10-Pa vmIPNs only, defect sites are created because of high swelling (see Results). Cells on such sites are excluded from image analysis in C. (B) Immunostaining of aNSCs differentiated under neuronal differentiation conditions. Cell lineage markers: progenitor cell marker nestin (green), mature neuronal marker β-tubulin III (red), and astrocytic marker GFAP (blue). (C) On left axis, β-tubulin III expression as a function of substrate modulus was assayed by QRT-PCR (n = 5–6). Note the log x-axis and peak in β-tubulin III near 500 Pa. On right axis (red), the percentage of cells that fell above a threshold of β-tubulin III intensity (red in b) is shown. Error bars are 95% confidence intervals. Means with same group letter are not significantly different from each other (analysis of variation Tukey-Kramer test, p < 0.05). The QRT-PCR value for the ∼10-Pa vmIPN includes cells on surface defects, and therefore likely overestimates β-tubulin III expression. All images were taken after 6 days of culture. Glial media label indicates DMEM/N-2 media supplemented with only 1 v/v % FBS on laminin-coated polystyrene.

