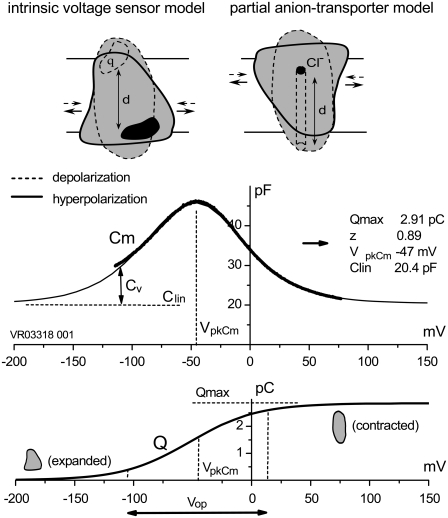
FIGURE 1.
Schematic representation of the IVS and PAT models for prestin, and definitions of prestin molecular parameters. (Upper) Conformational transitions between prestin expanded (solid lines) and contracted (dashed lines) states after membrane hyper/depolarization cycles, result from intramembrane translocation of either 1), prestin's charged moiety q (IVS model, left); or 2), Cl−/bicarbonate-binding moiety (PAT model, right). (Middle) Experimentally measured (in OHCs) bell-shaped C-V curve (heavy line) is composed of a passive capacitance of a membrane lipid bilayer (Clin) and a bell-shaped voltage-dependent component of membrane capacitance (Cv) originating from intramembrane translocation of prestin's charged voltage sensor at membrane voltages within the prestin operation range (Vop, indicated in lower panel). The thin line is a two-state Boltzmann function first-derivative fit (see Methods) to a C-V component, from which the parameters characterizing prestin conformational transitions (Qmax, z, and VpkCm (inset)) are obtained. Intracellular and extracellular solutions were Tris-Cl(i) and Tris-Cl(o), respectively. (Lower) Integration of the Cv component from the middle panel reproduces a Boltzmann function that characterizes prestin voltage-dependent transitions between expanded (hyperpolarization) and contracted (depolarization) states. The range of membrane potentials between 10% and 90% of prestin molecules residing in the contracted state is defined as prestin's voltage operation range (Vop; see Methods).

