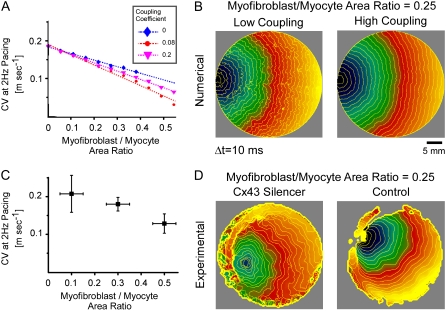
FIGURE 5.
Conduction velocity at 2 Hz versus percentage of myofibroblasts. (A) Simulation results, with three levels of myofibroblast coupling coefficient. (B) Typical activation maps (myofibroblast/myocyte area ratio = 0.25, low and high myofibroblast coupling coefficients) showing fragmented wavefronts at low coupling. (C) Experimental results, n = 15; p < 0.05. (D) Typical activation maps (myofibroblast/myocyte area ratio = 0.25, with and without myofibroblast Cx43 silencer) reproduce numerical prediction.

