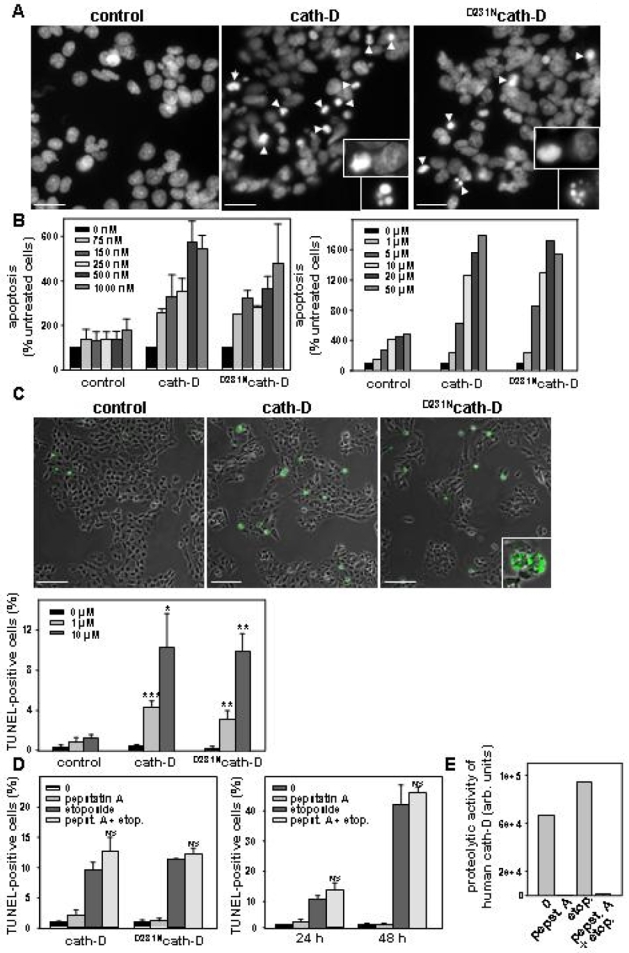
Figure 2. Catalytically-active and -inactive cath-D amplify etoposide-induced apoptosis.

(A) Staining of nuclei with DAPI. Arrows indicate condensed chromatin and apoptotic bodies. Insets show DNA condensation and apoptotic bodies at a higher magnification. Bars, 23 μm. (B) ELISA apoptosis. Apoptosis induction was quantified on pooled floating and adherent cells using a cell death ELISA. (C) TUNEL assay. Representative immunocytochemistry of apoptotic cells (top panel). Apoptosis was analysed on adherent cells and floating cells cytospun on glass slides using the TUNEL method. Inset shows apoptotic bodies. For quantification of apoptotic cells (bottom panel), three fields for each experimental condition were chosen by random sampling and the total number of cells and the number of TUNEL positive nuclei were counted from adherent and cytospun floating cells. The results are expressed as a % of the estimated total number of cells present in the field. *, p<0.01, **, p<0.025 and ***, p<0.0025 versus control cells (t-test). Bars, 69 μm. (D) Effect of pepstatin A on cath-D-induced apoptosis. Cells were pre-treated or not with pepstatin A and then were treated or not with 10 μM etoposide for 24 h (left panel). NS (non significant), p<0.1 and 0.15 versus etoposide for cath-D and D231Ncath-D cells (t-test). Time-course analysis of apoptosis in the presence or absence of 100 μM pepstatin A was performed with cath-D cells (right panel). p<0.25 versus etoposide (t-test). (E) Effect of pepstatin A on cath-D catalytic activity analysed using a fluorogenic substrate.
