FIG. 6.
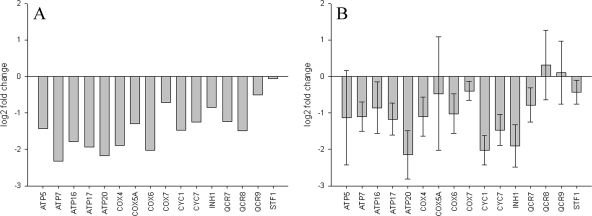
(A) Log2-transformed change (n-fold), as determined by microarray analysis, comparing BY4741 N2-treated cells to CO-treated cells at 30 min in anoxia for 16 transcripts of genes involved in aerobic metabolism. These 16 transcripts were found to be relatively most abundant in CO-treated cells at 30 min in anoxia. Most of the transcripts are less abundant in N2 by at least twofold. (B) Log2-transformed change (n-fold), as determined by qRT-PCR analysis, comparing BY4741 N2-treated cells to CO-treated cells at 30 min in anoxia for the same 16 transcripts described in panel A. Similarly to the microarray results, most of the transcripts were found to be less abundant in N2. Data are from five replicate qRT-PCR runs; error bars represent standard errors of the means.

