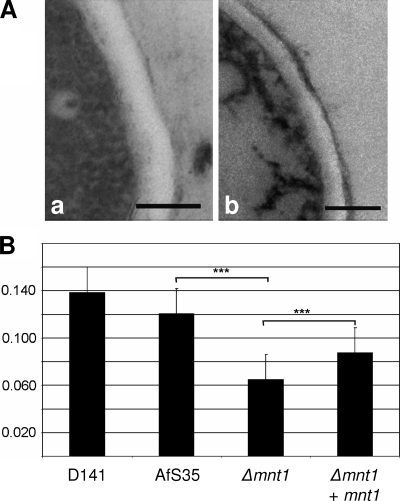
FIG. 3.
Analysis of the effect of the afmnt1 deletion on the hyphal cell wall using transmission electron microscopy. (A) Representative micrographs of the cell walls of the parental strain AfS35 and the Δafmnt1 mutant grown at 37°C are shown in images a and b, respectively. Bars represent 0.2 μm. (B) Graphic representation of the mean values and the corresponding standard deviations of the thickness of the cell walls (in micrometers) determined for the wild-type strain D141, the parental strain AfS35, the Δafmnt1 mutant, and the complemented mutant Δafmnt1 afmnt1. The cell wall was measured 20 times for each strain. ***, P < 0.0001 by Student's t test.

