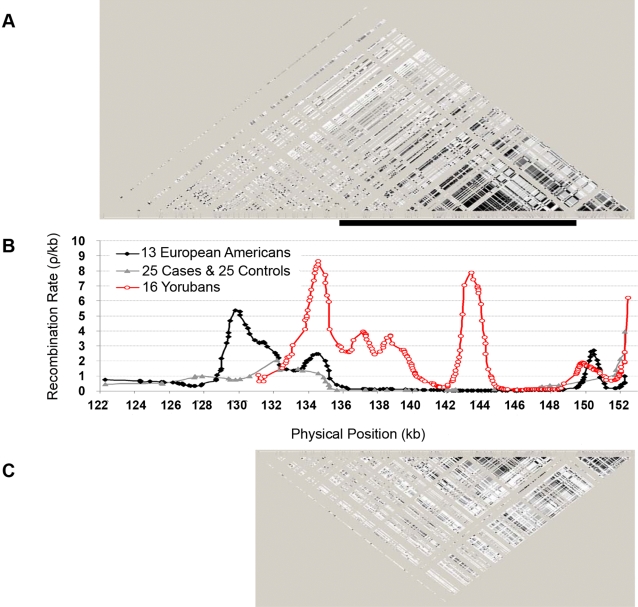
Figure 1. Local linkage disequilibrium (LD) structure and recombination rates (based on SNPs with minor allele frequencies > = 0.05 in a 30 kb region of FHIT intron 5).
A. Graphical representation of pair-wise r2 (from 0 to 1 represented with gray scale from white to black) calculated and visualized using Haploview for 13 European Americans. B. Recombination rates (Rho) calculated using rhomap for Yorubans (red line, with SNP positions represented by open circles) and European Americans (black line, with SNP positions denoted by solid diamonds) based on sequencing data. The grey line with solid triangles was based on genotyping data on 51 SNPs from 25 cases and 25 controls (European Americans). C. Graphical representation of r2 using for 16 Yorubans. A solid black bar represented a 15 kb LD block in the European American.

