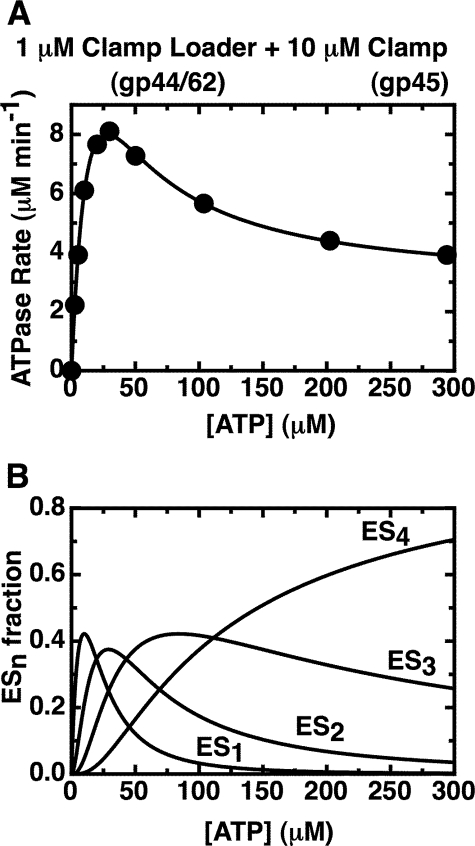
FIGURE 3.
Fit of the overall ATPase rates of the gp44/62-gp45 complex to the sum of the activities of species carrying one, two, three, and four bound ATPs. A, measured ATPase rates obtained with 1 μm gp44/62 in the presence of excess (10 μm) WT-gp45 (data points) are plotted together with the fit (solid curve) of the data to Equation 2 (see “Experimental Procedures”). A Kd value of 27 μm was used for the binding of the ATP ligands, and the best fit values (see “Experimental Procedures”) for the rates at which ATP is hydrolyzed by complexes carrying one, two, three, and four bound ATP molecules are 30.5 (±0.6) μm min-1, 24.1 (±0.5) μm min-1, 7.4 (±0.2) μm min-1, and 2.87 (±0.3) μm min-1, respectively. B, calculated fractions of the different ATP-bound enzyme species in solution are plotted as a function of ATP concentration. The enzyme binds four ATP molecules with a Kd value of 27 μm. ES1, ES2, ES3, and ES4 represent the concentrations of enzyme species with one, two, three, and four ATPs bound, respectively, as a function of input ATP.

