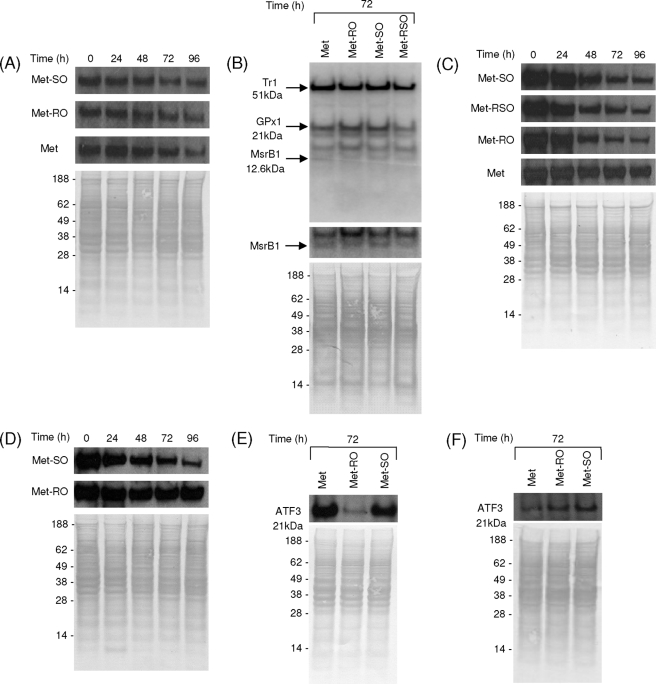
FIGURE 6.
CBS, ATF3, MsrA, and selenoprotein expression in SK-Hep1 cells grown in Met and Met sulfoxide media. A, Western blot analysis of MsrA in SK-Hep1 cells grown in media containing 0.1 mm Met, Met-RO, or Met-SO at 0, 24, 48, 72, and 96 h. B, metabolic labeling of SK-Hep1 cells grown in media containing Met, Met-RO, Met-SO, or Met-RSO, with 75Se. Cell extracts were analyzed by SDS-PAGE, and the 75Se pattern was visualized with a PhosphorImager (upper panel). Migration of major selenoproteins, thioredoxin reductase1 (Tr1), and glutaredoxin peroxidase1 (GPx1) is indicated. Migration of MsrB1 is also shown, and the corresponding area of the gel is enlarged in the middle panel. The bottom panel shows protein loading. C, Western blot analysis of CBS in SK-Hep1 cells grown in media with 0.1 mm Met, Met-RO, Met-SO, or Met-RSO at 0, 24, 48, 72, and 96 h. D, Western blot analysis of CBS in fRMsr-expressing SK-Hep1 cells grown in media containing 0.1 mm Met-RO or Met-SO at 0, 24, 48, 72, and 96 h. E, Western blot analysis of ATF3 in SK-Hep1 cells grown in media with 0.1 mm Met, Met-RO, or Met-SO at 72 h. F, Western blot analysis of ATF3 in fRMsr-expressing SK-Hep1 cells grown in media containing 0.1 mm Met, Met-RO or Met-SO at 72 h.

